RAI2026_— Russia's artificial intelligence market: AIANA research, August 2026
Russia's Artificial Intelligence Market
August 2026
Contents_
How big is Russia's AI market? Four ways to count it — four different answers_
- MarketsandMarkets286 bn ₽
- IMARC Group500 bn ₽
- Stanford AI Indexdoes not count it
Russia is counted from a distance: a global model is filled with secondary data — publications, press releases, other people's analysis. Russian company accounts are not examined and vendors are not surveyed. Hence the twofold gap between two estimates of one and the same market.
- Yakov & Partners7.9–12.8 tn ₽
- of which gen. AI1.6–2.7 tn ₽
- National AI Strategy11.2 tn ₽
This is not the market's money but the gain to those who buy AI: how much the economy stands to win by 2030. It is built from a survey of 150 CTOs and a model covering 16 industries. It measures benefit rather than revenue, and it describes the future — yet it gets quoted as the size of the market today.
- Apple Hills Digital25 bn ₽
- BDA, B1, TAdviser46 bn ₽
- Just AI, Onside58 bn ₽
The counting is careful and the method is disclosed, but each team takes its own slice: software only, generative AI only, or platforms inside the data market only. Services, hardware and products where AI is merely one feature fall outside the count. The data comes from questionnaires filled in by 40–150 unnamed companies.
- Companies in the sample883
- Market breakdown6 segments, 30 subsegments, 66 categories
- Period covered2023–2025
The main limitation: the AI share of each company's revenue is our expert estimate, but across hundreds of companies individual inaccuracies cancel each other out and barely shift the total. In exchange, the count depends little on the researcher's assumptions: revenue is taken from official financial statements, with no industry given priority and no tuning towards a convenient picture of the market. The scope is refreshed regularly, so the estimate can be built over time and the market tracked across a wide range of indicators.
This market cannot be counted from the outside
We count it from within, product by product
Our mission is to become the primary source of truth about Russia's AI market






The AIANA methodology: 7 stages of a bottom-up market estimate_
Building the market structure proved to be a critically important step of the research. The structure divides the artificial intelligence market into 6 fairly high-level core segments, from infrastructure to applications. Those 6 segments are then split into 30 subsegments and further into 66 product categories, and the largest of those are opened up one level further, into 6 subcategories. That depth makes it possible to look at the size of individual markets in fine detail.
The structure serves as the reference point when deciding whether to include a company in the artificial intelligence market or not. It is the frame that lets us show transparently which companies we assign to the market and which stay outside the study.
The list of companies was assembled from a range of sources: industry rankings, news, specialised registers and ordinary search-engine results. That approach let us build a sample independently of anyone else's ready-made estimates.
The list captured both large market players and very small companies and sole proprietors from Russia's regions. Every company was enriched with Federal Tax Service data, and all further estimates were built on top of it.
Declaring an AI transformation costs nothing, so every market participant was checked on the merits: can its product be assigned to the AI market under the AIANA taxonomy? We went through product pages, solution descriptions and even documentation to verify that the company has a product relevant to us and that the product is commercialised. Only then did it enter our database.
Existing registers and databases, in our view, do not fully reflect the real composition of the market: some companies get in without an AI product, while other players are missing altogether. That is why this screening became a distinct and important part of the data collection. It produced the final database of 883 companies.
Every company was examined separately: we split its products according to the market structure and allocated its revenue across the AIANA taxonomy — six segments, 30 subsegments and 66 categories. That is why the same company often appears in several market segments at once. Tagging the companies was the most labour-intensive stage of the whole study.
For each subsegment a company was assigned an AI-adoption coefficient (K-AI) by expert judgement. It shows what share of the company's total revenue is earned on AI in that subsegment, and ranges from 0 to 100%, where 100% means a fully AI-native company.
The coefficient was estimated largely by expert judgement. We took into account the company's own revenue, media coverage and indirect signals such as open job postings. Taken together, these signals allowed us to pin down K-AI more precisely.
We also adapted K-AI to the observation period. Using archived versions of company websites we reconstructed roughly when a company's AI product appeared (if it was not AI-native), and counted its revenue in the sample from that point on. As a rule, AI revenue grew faster than the core business each year, partly because of the lower base, so K-AI rose over time.
Most companies do not yet report AI revenue officially, so the coefficient remains an expert estimate. We recognise that such an estimate is exposed to a great many inaccuracies and may not reflect a company's real position or the true size of its artificial intelligence revenue.
To check it, we asked the companies themselves for more detail: do they have revenue from artificial intelligence, what share of core revenue does it account for, and do our estimates match the way the company assesses itself.
Where companies replied, our estimates were broadly close to their own. On top of that, a sample of hundreds of companies smooths out individual deviations, so at a high level of aggregation the market estimate stays accurate enough even allowing for small discrepancies.
Part of the market, predominantly B2C, remains unobserved. We work with limited liability companies, but in certain niches sole proprietors play an important role and no financial statements are available for them. On Avito, for instance, private sellers offer access to AI service APIs and tokens for foreign and Russian models. This is a meaningful part of the AI market, and we regard studying it as a separate task for the future. For now we have worked through several dozen sole proprietors from the sample as an illustration of the approach.
We reconstructed the revenue of such sole proprietors from comparable companies for which statements are available:
- Matching against the SME register: the size class sets the upper bound on revenue (micro up to 120 mn ₽, small up to 800 mn, medium up to 2 bn). The status is confirmed for 69 of the 87 sole proprietors.
- Selecting a reference group: LLCs of the same SME class and the same segment with available statements.
- The average revenue of the reference group is taken as the revenue estimate for the sole proprietor.
- K-AI coefficients are applied to that revenue under the general rule of the calculation.
Market structure_
There is a great deal of talk about Russian AI, yet almost nobody counts what it is made of. The conversation runs through big names and individual products, and a picture like that reveals neither the size of the market nor the way it works: where the money sits, who pays it and what exactly for.
This chapter takes the market apart: how much it weighs, how it is put together, which companies stand at each level and who writes the cheque. Structurally it is a young market — the money is concentrated at the bottom, in hardware and compute. But it also holds something young markets rarely have: finished products with tens of millions of users.
Russia's AI market is already real: 316 bn ₽ (~$3.7 bn) of reported revenue across 883 companies_
Constant returns to scale. The more companies there are, the more revenue they account for
Increasing returns. A small number of large companies generates more than a third of market revenue
Diminishing returns. Many AI-native startups that bring in relatively little revenue
316 bn ₽ (~$3.7 bn) means one thing above all: Russia's AI market already exists. Not in theory and not tomorrow — it exists now, it has a measurable size, and we analysts have something to count. And this is not media noise but real reported revenue — money companies have genuinely earned on AI.
883 companies is a great many, and that is excellent news. In effect the country's entire IT industry has turned towards AI. The market works as a whole ecosystem: GPU suppliers, software developers and professional implementation services alike — there is room for everyone for years to come.
And for us this is a special moment: this is our first report on the AI market, and we are genuinely excited by it. This is only the beginning!
* Total number of unique brands in the sample. 752 of them disclose AI revenue for at least one year out of 2023–2025, and 734 for 2025. The distribution by AI-adoption level is built on those 734 companies
Fill in the form to carry on reading the research. We size the AI market from company financial statements, and we want to know who this research is for: which companies our readers come from and what problems they are solving. Five fields and half a minute — valuable information for us, and for you a chance to be first to receive future research and data updates.
Coming up — market structure, dynamics, geography and the summary of the research.
The AI market is a living tree: the parts feed one another and grow together_
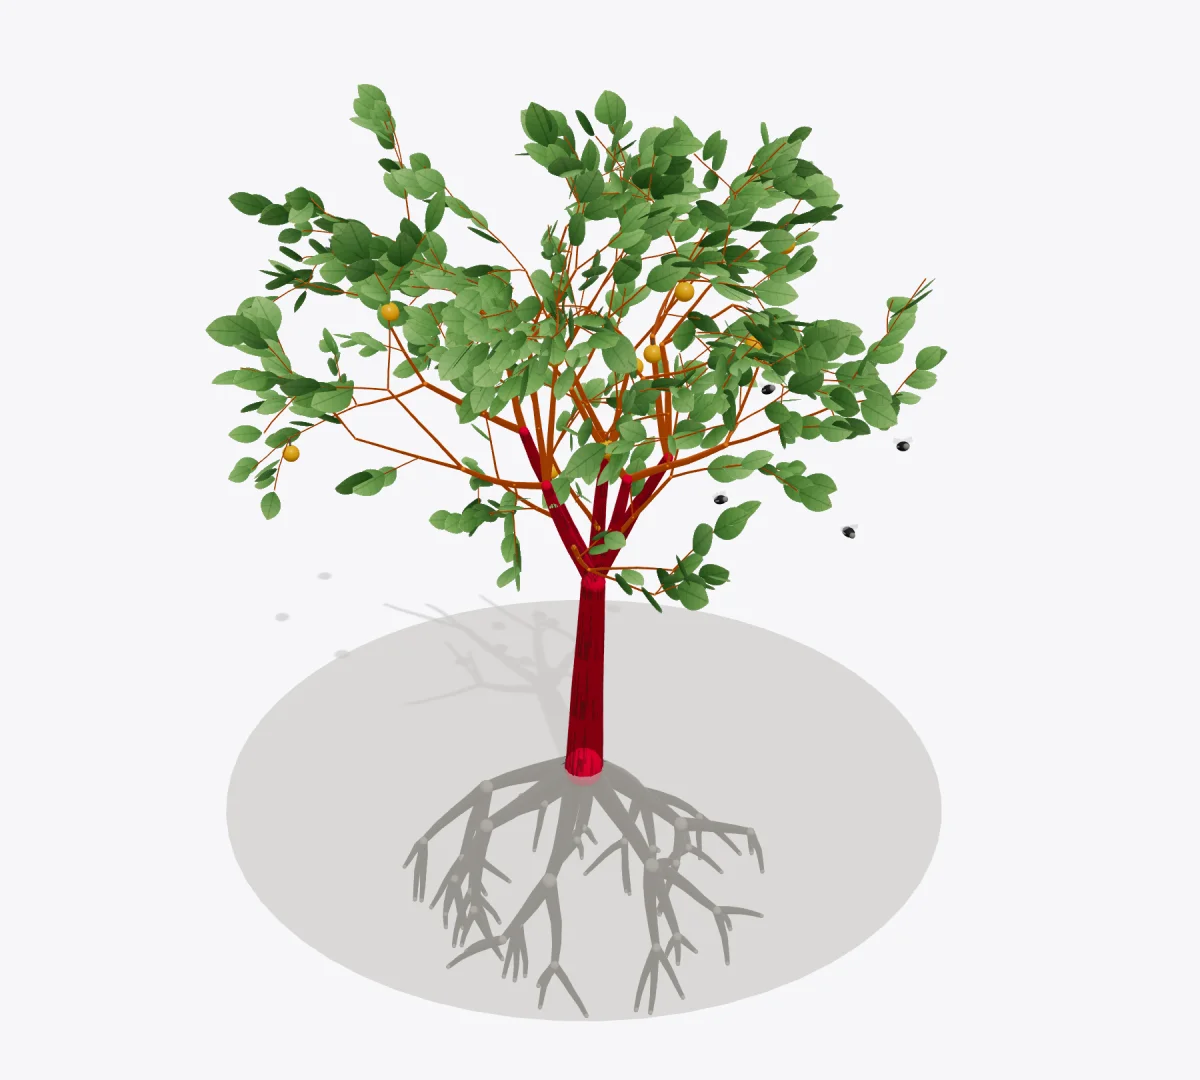
The AI market taxonomy: 6 segments → 30 subsegments → 66 categories → 6 subcategories_
- AI market
- AI hardware
- Memory and storage
- Turnkey storage systems
- System memory (DDR, DIMM)
- Solid-state drives (SSD/NVMe)
- On-accelerator memory (HBM)
- Server systems
- Compute
- General-purpose processors (CPU, GPU)
- Specialised accelerators (NPU, TPU, ASIC, FPGA)
- Data-centre infrastructure
- Cooling (air, liquid, immersion)
- Power supply
- Network (within the data centre)
- Scale-out fabrics (InfiniBand, Ethernet)
- Network (within the rack)
- Scale-up interconnects (NVLink Switch, Infinity Fabric Switch, UALink)
- Network (on chip)
- Chip-to-chip buses and interconnects
- Memory and storage
- AI applications
- CV (Computer Vision)
- Video stream analysis
- Object recognition
- Image classification
- Face recognition
- Body pose estimation
- NLP (language processing)
- Pre-configured chatbots and assistants
- Knowledge base search (RAG, LLM Wiki)
- Text recognition and analysis
- Text generation and summarisation
- Speech recognition (Speech-to-Text)
- General-purpose AI agents
- Machine translation
- Predictive analytics
- Forecasting and optimisation
- Classification and scoring
- Recommender systems
- Anomaly detection
- Audio analysis
- Speech analytics
- Speech synthesis (Text-to-Speech)
- Sound event recognition
- Content creation
- Image generation
- Presentation and document generation
- Video and animation generation
- 3D and design generation
- AI avatar generation
- Audio and music generation
- Foundation model aggregators
- Foreign models (Claude, ChatGPT)
- Russian models (GigaChat, YandexGPT)
- Open-source models (Llama, Qwen)
- Health and self-care
- Fitness, nutrition, sleep trackers
- Mental health
- Education and self-development
- AI tutors and exam preparation
- Skill-building apps
- Personal finance and everyday life
- Financial assistants and robo-advisers
- CV (Computer Vision)
- AI clouds and platforms
- AI IaaS
- HPCaaS (supercomputers)
- Cloud infrastructure for AI
- GPU compute (GPUaaS, bare metal, clusters)
- AI PaaS
- AI assistants and IDEs for working with code
- Managed AI/ML platforms
- Chatbot and agent platforms
- AI application and agent platforms
- Core PaaS from cloud providers
- RPA (robotic process automation)
- Multi-agent system orchestration
- No-code/low-code builders
- Enterprise knowledge bases
- MaaS (Model as a Service)
- API access to foundation models
- Russian models (GigaChat, YandexGPT, T-Pro)
- Foreign models (Claude, ChatGPT, Grok)
- Open-source models (Llama, Qwen, DeepSeek)
- API access to foundation models
- AI IaaS
- AI devices
- Enterprise
- Robotic agents
- Consumer
- Stationary AI
- Smart speakers
- Implantable AI
- Neural implants
- Stationary AI
- Enterprise
- AI services
- Development and implementation
- Custom AI/ML product development
- AI solution integration
- Model fine-tuning
- Training
- Professional upskilling in AI
- Corporate AI literacy programmes
- AI consulting and strategy
- AI strategy
- AI maturity assessment
- Data collection and labelling for AI/ML
- Development and implementation
- AISec
- Vulnerability testing of AI models
- Data leak prevention
- Deepfake and synthetic content detection
- LLM firewall and runtime protection
- Model scanners and supply chain protection
- AI hardware
Five principles the market taxonomy rests on_
We describe the AI market as a value chain: each layer rests on the one below and is impossible without it. At the bottom is AI hardware: servers, accelerators, chips. Above it sits AI infrastructure and platforms: compute capacity and development environments — in essence IaaS and PaaS tuned for AI. At the top are AI applications: software that needs both layers underneath.
AI services and AI cybersecurity do not slot into the vertical; they span all of its levels at once. The first covers development, integration and support; the second is a new market that is only now taking shape, and we consider it one of the most promising.
A smart speaker joins hardware and software in a single product — splitting them across layers makes no sense, so we describe devices as one system.
The power sector serves the whole economy, not just AI. We treat it as a precondition for the industry to operate, but not as part of the market.
We split access to foundation models into two cases. First: the user connects to the model directly over an API and pays per token — buys a key and builds their own product on the model; that is AI platforms (PaaS). Second: the same model arrives packaged in a finished product — with a chat window, a model aggregator, prompt templates; that is AI applications.
How Russia's AI market is put together in 2025_
| Segment | Size, bn ₽ | Market share | Companies in segment | Short description |
|---|---|---|---|---|
| AI hardware | 98.4 | 31.1% | 148 | Physical infrastructure for AI |
| AI clouds and platforms | 58.6 | 18.5% | 137 | Cloud AI infrastructure and platforms |
| AI applications | 71.5 | 22.6% | 386 | Ready-made AI products for an end task |
| AI devices | 44.6 | 14.1% | 9 | End devices with AI on board |
| AI services | 42.5 | 13.4% | 178 | Adopting AI: development, consulting, data labelling, training |
| AISec | 0.5 | 0.2% | 10 | AI security: protecting data and LLMs, and detecting deepfakes |
| Total | 316 bn ₽ | 100% | 868* | The entire AI market in Russia, 2025 |
* Three different counts are involved here and it matters not to confuse them. The sample holds 883 unique brands. 734 of them disclosed revenue for 2025: the remaining 149 are 87 sole proprietors, 26 legal entities with undisclosed statements, 20 registered in 2025–2026, 10 companies without a tax number and 6 liquidated. Those 734 companies produce 868 rows in the table, because 118 of them operate in — and are counted in — several segments at once
Buyer type is assigned for every "company × subsegment" pair. If a company sells to two types at once, its revenue is split 60% to the primary buyer and 40% to the second; with three types it is split evenly. Shares are calculated from 2025 AI revenue
The market's blind spot: 10% of participants that financial statements cannot see_
The research relies on the financial statements of limited liability companies, that is, on predominantly corporate-facing businesses. As a result, the AI market in our estimates is represented chiefly by the B2B segment. Yet a substantial part of the market — above all B2C, but partly B2B too — operates through sole proprietors and the self-employed and systematically escapes the statistics. Services, hardware sales and the resale of LLM access, for instance, often go through marketplaces, most frequently Avito, and such deals stay outside any reporting. This segment requires a separate methodological approach, and in the present study the task is only partly solved.
2.2 bn ₽estimated AI revenue attributable to sole proprietors
316.1 bn ₽the market counted from the statements of LLCs and PJSCs
The contribution of sole proprietors to total market revenue is so far estimated fairly modestly: 0.7% of the market against 10% of participants. The real scale may be larger, since some sole proprietors could not be fully identified. On top of that, much of the selling goes through marketplaces, which may also generate revenue in this part of the market.
Doubling every two years: the market added 154 bn ₽ (~$1.8 bn), and more than a third came from the foundation_
Between 2023 and 2025 Russia's AI market almost doubled: from 162.2 to 316.1 bn ₽ (~$1.9 to ~$3.7 bn). The gain over those two years is 154 bn ₽, an average annual rate of 40% — that is, a doubling every two years. Industries usually regarded as fast-growing add 10–15% a year: here the pace is three times higher. By global standards it is high too: the US AI market, the world's largest, grows by roughly 25% a year. The gap rests partly on a low base — in absolute money the two markets are not comparable. But in the speed of technology adoption Russia is keeping pace with the world.
The growth was assembled by the foundation, not by industries. Infrastructure AI delivered 37.5% of the 2023–2025 gain while holding a 32.8% share of the market; industry AI shows the opposite picture: 21.4% against 24.8%. The money is still going into capacity rather than into industry deployments. Meanwhile growth in AI hardware has already slowed from 41% in 2024 to 20% in 2025, which means the industries' turn is approaching.
AI accounts for between 0.7% and 44.6% of participants' revenue: every segment has its own depth_
AI takes 9 ₽ out of every 100 spent on Russia's IT market_
The AI market is growing faster than the rest of IT. Two years ago 6.5 ₽ of every 100 ₽ of IT market revenue went to AI; in 2025 it is 9 ₽.
The gap in growth rates is not narrowing. In 2024 the IT market grew by 25% and AI by 50%. In 2025 the rates fell to 11% and 30% respectively. The ratio between them, meanwhile, rose from 2.0 to 2.7.
In absolute terms the pattern is the same. Annual growth of the IT market shrank from 654 to 374 bn ₽. Growth of the AI market barely changed: 81.5 bn ₽ in 2024 and 72.4 bn ₽ in 2025. The slowdown left the AI segment almost untouched, so its contribution to the IT market's annual growth reached 19.4%.
As long as the ratio of growth rates holds, the AI share will keep rising. At the current pace it will pass 11% by the end of 2027.
Every layer of the market grows at its own pace: from 30% to 97% a year_
AISecCAGR 23–25 97%
The segment is only taking shape: 0.2% of the market. Cyber-resilience requirements make protecting AI mandatory. The global market will form first; the Russian one starts with a lag but grows very fast
AI servicesCAGR 23–25 49%
The main driver is corporate demand for in-house AI solutions: both development and integration are growing. The second source is the applications themselves: where the capabilities of an LLM fall short, specialists close the gap
AI devicesCAGR 23–25 30%
The backbone of the segment is smart speakers. The average price is rising, unit sales are inching up, and the replacement cycle is measured in years. So growth will stay moderate
AI applicationsCAGR 23–25 40%
Growth is driven by large LLMs and by small models with a cheap token: together they widen the range of tasks that pay for themselves inside a product. The number of such companies will keep rising
AI clouds and platformsCAGR 23–25 65%
Compute is moving from ownership to rental: providers lease GPUs and sell inference on demand. Pay-as-you-go removes the capital barrier, hence the rapid growth
AI hardwareCAGR 23–25 30%
The driver is training and fine-tuning models, including open-weight ones. The market is supply-constrained: prices rise and pull revenue up at the same volumes. In Russia prices are pushed higher still by the sanctions risk around imports
Hardware is losing share, but not money: compute is moving to rental_
A familiar story: first they bought, now they rent
AI is going through the same cloudification that classic IT went through, only faster. The logic is familiar: first you buy your own hardware, then you realise capacity is cheaper to rent. In IT the shift took a decade and a half. In AI the hardware share shrank from 36% to 31% while clouds grew from 13% to 18.5% in two years.
The reason lies in the nature of the technology: training and inference need expensive accelerators that are loaded unevenly and go out of date in a couple of years. Not everyone can buy them; almost anyone can rent them. Hence the gap in growth rates: clouds grow 65% a year against 30% for hardware.
Hardware is not going anywhere, though: in money terms it grew from 58 to 98 bn ₽ between 2023 and 2025. What changes is not the volume but the point of access to compute.
If the current pace holds, the AI market could reach 830 bn ₽ (~$9.8 bn) by 2030, accumulating a further 3.1 tn ₽ over the five forecast years_
Geography_
AI companies operate in most regions, yet the money is gathered in a single point: 80.8% of market revenue falls to Moscow. The skew is stronger than in the IT industry as a whole, and it is not explained by the size of the capital alone.
This chapter shows where the companies and their revenue physically sit, why Moscow holds such a share, and which cities generate the most AI revenue per resident.
The AI market map: companies are everywhere, the money is in Moscow_
Moscow is the core of Russia's AI market, accounting for more than 80% of its size_
Moscow is the pole of concentration of the Russian economy. The city accounts for 21% of the country's gross product with one eleventh of its population. The reason is simple: most large corporations are registered here, and a significant part of the economy gathers around them.
In AI the concentration is higher still. The capital accounts for more than 51% of the market's companies, with all the rest of Russia holding less than half. And that half of the participants generates more than 80% of the revenue of the entire Russian AI market.
In effect Moscow is the country's AI centre. The most comfortable conditions for such companies to appear have formed here: technology parks, Skolkovo, startup support funds. The capital is also home to large IT companies that develop AI solutions of their own: Sber, Yandex, MTS, VK and others.
Moscow is treated within the administrative boundaries of the federal subject; the Moscow Region is not included. Population and economy shares use the latest available Rosstat data; AI market figures are for 2025
AI revenue per resident mirrors the map of science and technology: Innopolis is five times ahead of Moscow_
Mini-map basemaps: © OpenStreetMap contributors, © CARTO
Tech trends_
Russia's AI market stands on a global technology base: accelerators, models and inference prices all come from outside. So domestic demand is driven not only by the country's own economy but also by what happens to the world's stock of compute.
This chapter brings together three storylines: the global fleet of AI accelerators and how fast it doubles; the budget of a data centre, which shows where the money goes in construction and in operation; and the split of models into two classes — frontier models for reasoning and light models for the stream of agent requests.
The world's fleet of AI accelerators doubles every seven months_
The compute base of AI has been growing three- to fourfold a year for the fourth year running. The fleet's rated power is 13 GW, 5% of the capacity of Russia's power stations. An accelerator only pays for itself under continuous load, so the fleet is assembled by model owners and clouds.
The second shift is in the mix of suppliers. Over two years NVIDIA's share fell from 81% to 69%*: large buyers design chips for themselves, and outside the United States Huawei has mastered production. Its fleet holds 1.3 mn Ascend chips, and the top-end 910C delivers ¾ of the performance of an H100. For countries under export controls, Russia included, Ascend is the most promising available channel to industrial compute.
* share as of Q1 2026, data preliminary: for that quarter the source updated only NVIDIA and Google
AI is hardware: GPU servers take 56% of the build and 59% of running costs_
The money in AI infrastructure goes into hardware: in construction and in annual costs alike, servers take more than half. Energy, the subject of most of the argument, costs 7% of the annual total — the electricity bill is smaller than the depreciation of the accelerators.
The reason lies in service lives: servers are written off over five years, the building serves fourteen, and one shell outlives three generations of accelerators. With a three-year life the annual cost rises to $120 mn; with seven it drops to $70 mn. Demand for compute feeds the chipmaker above all.
Models have split into two classes: light ones deliver 63% of requests on 34% of tokens_
Models have diverged by purpose. At the top is the frontier: eight models fit into a band from 50 to 61 points, and general intelligence has ceased to be one laboratory's monopoly. Below sits the layer of light models — it serves agents and collects two thirds of all API calls.
The difference is explained by the length of the task. A heavy model is handed 60–70k tokens of context and a long chain of reasoning; a light one gets 2–10k, a single agent step. An agent breaks work into hundreds of short calls, so the request count grows faster than the token count.
The state and AI_
The state takes part in the AI market three times over: as a customer, as an investor and as a regulator. The budget pays for 12.5% of market revenue, the federal project provides 9 bn ₽ (~$106 mn) a year, and the AI law is in its second year of being rewritten between bans and relaxations.
This chapter examines three cross-sections: where state money goes in Russia, how regulation has changed since 2019, and what 25 economies around the world are doing with AI — from direct budget commitments to closing the market to other countries' models.
Where is state investment in AI going?_

The bans were dropped from the AI law, but critical infrastructure was closed to foreign software_

…
China is promising AI more than the other 24 economies — and one has closed its market_
| Country | State money | Sover. | Commitments |
|---|
Summary_
Six segments, 883 companies and 316.1 bn ₽ (~$3.7 bn) of revenue come together in one table: the size and growth rate of each segment, concentration, buyer type and Moscow's share, all on a single screen.
From here the research takes the market apart from two sides separately: by supply segments and by demand industries.
Summary: the AI market in one table_
| Segment | Size 2025 bn ₽ |
Market share % |
Change in share 2023 → 2025, pp |
CAGR 2023–2025, % |
AI adoption 2025, % |
Companies 2025 |
Buyer type, %B2BB2GB2C |
|---|---|---|---|---|---|---|---|
| AI hardware | 98.4 | 31.1 | 4.8 | 30 | 8.1 | 148 | 86.312.21.5 |
| AI applications | 71.5 | 22.6 | 0.1 | 40 | 33.4 | 386 | 73.019.37.7 |
| AI clouds and platforms | 58.6 | 18.5 | 5.3 | 65 | 17.6 | 137 | 93.36.60.1 |
| AI devices | 44.6 | 14.1 | 2.1 | 30 | 44.6 | 9 | 4.90.594.6 |
| AI services | 42.5 | 13.4 | 1.6 | 49 | 13.5 | 178 | 77.522.10.4 |
| AISec | 0.5 | 0.2 | 0.1 | 97 | 0.7 | 10 | 70.229.80.0 |
| The market as a whole | 316.1 | 100 | — | 40 | 15.4 | 868* | 71.912.515.6 |
* The sample holds 883 unique brands. 734 of them disclosed revenue for 2025 — that is the number shown in the strip above. Those 734 companies produce 868 rows across segments, because 118 of them operate in — and are counted in — several segments at once
Dear readers, thank you for taking the time to read AIANA's first report on Russia's artificial intelligence market in 2026. We hope it was informative, easy to use, and answered the main questions you may have had.
We will go on updating the data on Russia's AI market, so we would be grateful for your feedback: any suggestions or remarks will help make the next study more interesting and more useful still.
We will also publish new research shortly, available on the AIANA analytics platform: people and skills in the AI market, company rankings, customer profiles, and hardware pricing. You can follow the updates on our website and on our Telegram channel @aiana_ru, where the freshest insights from our work appear.
The AIANA team
Your request has been sent. An AIANA partner will get in touch within one business day.
We build a verifiable base of the companies that make up Russia's AI market. The size of the market equals the sum of the sample's AI revenues for the year.
Most studies stay at a high level of aggregation — sizing the market through TAM/SAM/SOM, for example. Such an estimate depends heavily on the researcher's assumptions and changes several-fold when they change, and it does not show the structure of the market in any detail. The second common source is survey data. There, companies tend to flatter their financial results, so the estimate is biased.
We rely only on verifiable data: official company financial statements or Federal Tax Service revenue records. Across a sample of hundreds of companies individual biases cancel each other out, and the market estimate stays sound.